

By John Hunter, author of the Curious Cat Management Improvement Blog.
Plot data over time
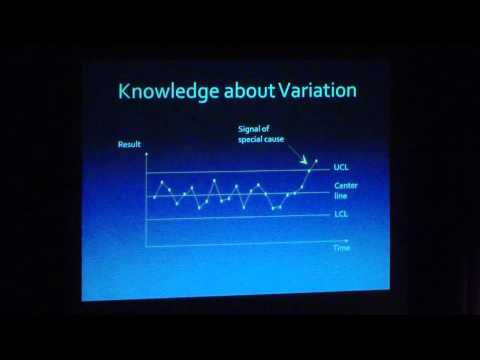
In this segment of Ian Bradbury’s talk at the 2013 W. Edwards Deming Institute conference he discusses variation and using the control chart to aid improvement efforts.
This last point went outside the control limits so it is a signal of special cause. For that particular point it makes sense to ask the question – what was special, what was different about the conditions underlying the generation of this point of data versus the others.
If we didn’t have something like that, if all of the points were varying inside the control limits then it doesn’t make any sense, or it is unlikely to be a productive exercise to be asking why one point is lower or higher than another. That doesn’t mean there isn’t anything to learn, there isn’t anything to improve a system like that… to the contrary the improvement process is one where first of all we focus on the special causes of variation… and get the process into a state of statistical control.
Once we get it into a state of statistical control, then we move into a different kind of question. Now the questions is, what is common to all the underlying conditions that generated all of these points? What is the underlying system that generated this? What kind of system changes might we make that could cause a change in the overall variability of these results?
Understanding how to use control charts to manage more effectively is one of the areas that normally takes people a bit of time to become comfortable with. We are so used to treating every data point as special it takes awhile to improve our ability to learn by using special cause thinking (where we seek to learn why that point was different) only when it is the most effective way to learn (when their is evidence a special cause exists) and otherwise (most of the time) use common cause thinking. When the point is just the natural result of the process which includes variation from one point to the next it is not effective to think about what is special about a specific point, the more effective method to improve is to improve the process that generates all the results.
The improvement thinking that is most effective when there is no indication of a special cause is one which looks at the entire process and uses experiments (the PDSA cycle) to try out process changes. Based on what is learned from the experiments, then change the process to incorporate methods that improve results.
Using control charts effectively really isn’t very complicated; though it is something that does seem a bit difficult for people to learn to apply on their own. It is one of the areas where having a coach or consultant help at the beginning is often more effective than just trying to read about it and then apply it yourself.
Though really it is no more complicated than what is stated above: use our normal way of thinking (treating the data point as a special cause) when a special cause indication is shown and use the PDSA improvement/learning cycle when there is no indication of a special cause. Of course, actually doing that isn’t quite as easy as reading it or just understanding the implications of managing that way.
Related: We Need to Understand Variation to Manage Effectively – Ron Moen Webcast: Prediction is the Problem – Knowledge of Variation – Understanding Variation by Tom Nolan and Lloyd Provost